


Breaking News
 The Decentralization Trifecta: How Battery Tech, Robotics & Local AI Will Set You Free
 The Idiocracy that Is California Politics
 Whose Life is RUINED? Epstein Files Release Special News Update
 The Epstein Story Isn't Going Away - SF678
Top Tech News
 How underwater 3D printing could soon transform maritime construction
 Smart soldering iron packs a camera to show you what you're doing
 Look, no hands: Flying umbrella follows user through the rain
 Critical Linux Warning: 800,000 Devices Are EXPOSED
 'Brave New World': IVF Company's Eugenics Tool Lets Couples Pick 'Best' Baby, Di
 The smartphone just fired a warning shot at the camera industry.
 A revolutionary breakthrough in dental science is changing how we fight tooth decay
 Docan Energy "Panda": 32kWh for $2,530!
 Rugged phone with multi-day battery life doubles as a 1080p projector
 4 Sisters Invent Electric Tractor with Mom and Dad and it's Selling in 5 Countries


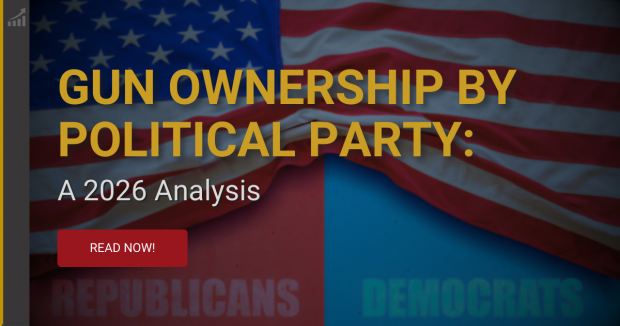
Gun Ownership by Political Party: A 2026 Analysis
Report Highlights:
• Republicans are 2.25 times more likely to own firearms than Democrats.
• Independent voters reported 29% ownership rate in 2000 and 2023, lower than Republicans and higher than Democrats.
• Republican women are 14% more likely to own guns than Democrat men.
• Protection is the main reason for gun ownership across all political parties.
Methodology
Gun ownership data were drawn from nationally representative surveys conducted by Pew Research Center, Gallup, the General Social Survey, and YouGov between 2000 and 2024.
Figures reflect self-reported, personal firearm ownership among voters who identified as Democrats, Republicans, or independents. Where only household data were available, this is noted. Trend comparisons used consistent question wording across survey years.
Gun Ownership by Political Party in 2025
According to surveys in 2024, Republicans are 2.5 times more likely to own firearms than Democrats.1, 2, 4, 5
Nearly half (45%) of Republican voters stated they own a firearm, while less than one quarter (20%) of Democrats said the same.
What Percentage of Democrats Own Guns?
In 2024, 20% of Democrat voters reported owning firearms, making them the voter group least likely to own firearms.
What Percentage of Republicans Own Guns?
In 2024, 45% of Republican voters reported owning firearms. Republicans were 2.25 times more likely to own guns than Democrats, and 1.55 times more likely to own guns than independents.
What Percentage of Independents Own Guns?
Between 2019 and 2024, 29% of independents reported owning firearms. Independent voters reported a spike in ownership in 2013, with some surveys showing rates as high as 44%.
Gun Ownership by Political Party: Trends Over Time
In 2000, 32% of Republicans reported owning firearms, compared to 23% of Democrats and 29% of independents.
The gap between gun ownership among political parties has broadened over the past 25 years. Democrat gun ownership has declined by three percentage points since 2000, while Republican ownership has increased by 13 percentage points.
Independents reported 29% ownership in 2000 and 29% ownership in 2023 (when they were last surveyed), with spikes in ownership reported in 2013 ( 48%) and 2017 (36%).
Gun Ownership by Political Party: Gender
In 2024, Republican males were most likely to own firearms (60%) of all genders and voters. Independent male voters followed at 39% ownership.
Republican women (33%) were more likely to own guns than Democrat men (29%), Democrat women (12%), and independent women (18%).
Learn more https://ammo.com/research/gun-ownership-by-political-party