










Breaking News
 Covert Pentagon Propagandists Are Tracking Anti-War Americans, Skirting The Law
 'We Hacked the FBI:' Hackers Say They Have Data on All FBI Employees
 Why Your Magnesium Isn't Working (3 Nighttime Mistakes)
 Your Robotic Vacuum Is Watching You -- Could It Someday Testify Against You in Court?
Top Tech News
 Tesla Model 3 killer charges from 10 to 97% in just 9 minutes
 World-first unpowered DNA computer sets speed record
 I Power 5 Buildings Off-Grid. Here's How
 The US government is pushing hard to get a working nuclear fission reactor into space by late 2028
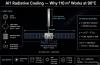 SpaceX Starmind AI in Space Radiator
 China Will Dominate Global Nuclear Energy Through 2035, Analyst Says
 These Absolutely Wild-Looking EVs Are Saudi Arabia's First Homegrown Cars
 BEYOND THE MOON: NASA plans a nuclear-powered fleet to push DEEPER into space
 Big Oil Backs Mazama's $135 Million Bet On Superhot Geothermal
 Quantum compass takes flight on Northrop's Lumberjack drone


The Technicals: The Next Move Looks Bullish but it Needs to Come Sooner Rather than Later

This analysis attempts to look at different metrics to understand the current momentum in the gold and silver markets. It is meant as an analysis on potential price direction in the very short-term (a few weeks to 1-2 months).
In Q1, the analysis highlighted the break of support in gold and silver of $5000 and $80 as a short-term bearish indicator with more downside risk ahead. That turned out to be another accurate call.
In Q2, the analysis conducted around $4150 mentioned we were nearing the bottom but still had room to move lower. While the full bearish case was not hit, gold did continue lower before a sharp turnaround in August.
After rebounding strongly off $4000 gold met resistance around $4600 and has since pulled back to consolidate further in the $4200- $4400 range. With the Fed turning more hawkish lately, precious metals lost some shine. So where is the data pointing next? Let's dive in…
Price Action
Gold and silver are still digesting the massive move seen in 2025 and January of 2026. While the pullback has been steep, it is not uncharacteristic given the massive move and the froth seen in the market. Both metals are consolidating comfortably above support around $4000 in gold and $55 in silver. However, both metals are also far from resistance which stand around $4650-$4800 and $72-$78.
This leaves the price action in a very neutral stance as both metals have plenty of room between both sides of key levels. A decisive break of either level on the upside or downside will trigger strong follow through. Until those key levels are hit, the price action is in a holding pattern.
The log chart is now looking like a mirror image of both 2008 and 2011. Based on the length of this bull market and the explosive moves over previous resistance, 2008 still seems like the more probable path (a sooner rally to new highs vs a multi-year downturn). However, a catalyst is needed soon to get moving higher or else metals could drift lower and potentially enter the 2011 type scenario. The metals need to challenge new highs again soon or $4000 and $55 come back into play as the key levels that will get broken.
Daily Moving Averages (DMA)
Gold
The bad news is that the 50 DMA and the current price sit below the 200 DMA of $4557. The good news is that both moving averages are sloping upwards. This is usually a bullish signal. Similar to the analysis on the log chart above, the price needs to start moving up soon or both curves will start sloping down. That becomes bearish. Time is working against the metals if they stay in this holding pattern too long. But until the lines slope down, the outlook tilts bullish.