










Breaking News
 Newsom Declares State of Emergency in Orange County as Experts Warn Chemical Tank...
 (VIDEO) Thomas Massie Says He "Will Not Rule Out" 2028 Presidential Run:
 WATCH: Thomas Massie Vows to Read Redacted Names in Epstein Files on House Floor...
 GENIUS! LA Mayor Candidate Spencer Pratt Uses Power Washer to Tattoo Filthy LA Sidewalks...
Top Tech News
 Cars Are Fast Becoming Dystopian Prison Pods...
 Our Emergency Water Plan Wasn't Good Enough - So We Built This
 Sodium Ion Batteries Can Reach 100 Gigawatt Per Hour Per Year Scale in 2027
 Juiced Bikes proves capable electric motorcycles don't have to cost a lot
 Headlight projectors turn your car into a drive-in theater
 US To Develop Small Modular Nuclear Reactors For Commercial Shipping
 New York Mandates Kill Switch and Surveillance Software in Your 3D Printer ...
 Cameco Sees As Many As 20 AP1000 Nuclear Reactors On The Horizon
 His grandparents had heart disease.
At 11, Laurent Simons decided he wanted to fight aging.
His grandparents had heart disease.
At 11, Laurent Simons decided he wanted to fight aging.
 Mayo Clinic's AI Can Detect Pancreatic Cancer up to 3 Years Before Diagnosis–When Treatment...



Which US States Gained The Most Residents In 2025
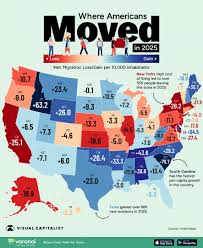
This map, via Visual Capitalist's Gabriel Cohen, shows net migration per 10,000 residents across all 50 states in 2025, revealing where population inflows were strongest and which states saw the biggest outflows.
Southern and Mountain West states dominated the rankings for inbound migration, while several high-cost coastal states continued to lose residents.
The data reflects large-scale shifts happening in the country's population distribution, both from the Eastern half to the Western half, as well as shifts away from more expensive states to cheaper, often inland ones.
The Mountain West Over the West Coast
In 2025, the Western half of the U.S. saw a continuation of post-COVID trends as people left behind coastal states like Washington (-10.7) and Oregon (-9.0) in favor of more inland Mountain West states like Wyoming (+26.0), Utah (+7.3), and especially Idaho (+63.2).
The data table below highlights the net migration loss/gain per 10,000 inhabitants in 2025:
