










Breaking News
 President Trump Amplifies Explosive "15% Band" Analysis Exposing Democrats' Algorithmi
 Election Worker Claims Republican Votes for Andy Biggs Were Discarded During Ballot Adjudication...
 Why Washington Ignores What 90% of Us Want
 Russell Brand vs. Britain's Untouchables: Sex, Power & the Royal Family
Top Tech News
 Prism puts an eye-controlled Linux computer on your face
 Remember Yesterday: AI For Today and Tomorrow
 Robot Mowers Invade America's Golf Courses, Putting Groundskeepers On Notice
 Monstrous 13-foot mecha craves the dangerous jobs humans avoid
 Scentronic tech lets you smell the internet
 Virgin Galactic's new rocket plane revives its bid for a space airline
 The metal kept moving east while the sellers ran, and Ronnie called the flush a week early
 Chinese Company Develops $1,000 AI-Powered Laser System To Kill Mosquitoes
 PRP vs Exosomes vs Stem Cells: Which Fits Your Condition?
 SHOCKING: The Secret (Frantzve) Family Business



President Trump Amplifies Explosive "15% Band" Analysis Exposing Democrats' Algorithmi
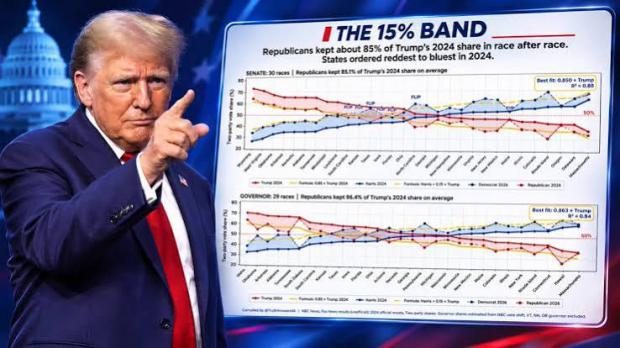
President Donald Trump has amplified a bombshell election analysis alleging a remarkably consistent voting pattern across dozens of Senate and gubernatorial races in the 2026 midterm elections.
The theory, dubbed the "85/15 Algorithm" that was originally posted by Truth Is Freedom X account, suggests that Republican candidates received approximately 85% of President Trump's 2024 vote share, while Democrats gained an amount equivalent to the remaining 15 percentage points of Trump's share, as The Gateway Pundit reported earlier.
Trump shared a post from the Truth Social account Truth Is Freedom, which presented the alleged statistical pattern across 59 Senate and gubernatorial contests.
The analysis compared the 2026 results with Trump's performance against Kamala Harris in 2024.
According to the post, one mathematical formula reportedly describes the shift:
Republican 2026 vote share = 0.85 × Trump's 2024 vote share
Democrat 2026 vote share = Harris's 2024 vote share + 0.15 × Trump's 2024 vote share
In plain English: for every 1,000 Trump points from 2024, roughly 850 stayed with the Republican candidate while 150 landed on the Democrat side. Republicans retained about 85% of Trump's share in Senate races and 86% in gubernatorial races. The formula explains 88% of the variation.
What makes the pattern so suspicious is its uniformity. It did not matter how red the state was. Wyoming, Ohio, Illinois, and Massachusetts all showed the same roughly 15% shift (p = 0.69).
The Democrat gain was sized by Trump's 2024 vote total, not Harris's. Drop any single state and the multiplier stays tightly between 0.846 and 0.853. The 0.85 multiplier outperformed standard election-swing models in every set of races tested.
Why Key Seats Flipped
At the 0.85 level, any state where Trump received under about 58.5% in 2024 falls below 50% for the Republican candidate in 2026. Texas, Kansas, Iowa, Ohio, South Carolina, and North Carolina all sat under that line. All of them flipped. Two completely different sets of races, different candidates, different campaigns, yet the same 15% decrease almost everywhere. Midterms are normally messy. This one was not.