










Breaking News
 House Passes Resolution Ordering President Trump to End the Iran War
 "Were you fooled by Trump?" (Tucker Carlson and Jess Elofson interview)
 Peter Thiel-Funded Company Anduril to Triple the Number of Autonomous Surveillance Towers...
 The Countries That Will Pay for the UN Tax Experiment
Top Tech News
 Quantum computing may soon become part of the microscope itself.
 Volkswagen Just Unveiled The Most Efficient EV Ever Tested
 NASA Super Light Solar Sail Project Will Be 12-40 Times Lighter and Faster
 Space Telescope Interferometer to Image Exoplanet Continents
 Twenty-five years of "temporary": how 9/11 built a surveillance state Americans never vote
 I'll Never Buy Another WALMART Battery!
 Shoei GT-Air 3 Smart helmet drops with built-in AR for $1,500
 AI Whistleblower Tells Tucker How AI Could Kill All Humans by 2040
 You Hate Flock? Well There's More...
 Will Spiking Diesel Prices Drive Autonomous Trucking?



The Curious Case Of The Dow Jones Industrials Chart

The $DJIA chart is telling an interesting story, technically speaking that is. Frankly not sure what the message is quite yet, but I find it fascinating hence it might be of interest to share.

First of all, note a behavioral set of facts I've pointed out on twitter: On Monday $DJIA again tagged its January 2018 highs and has again rejected. All rallies to new highs have been selling opportunities. All rate cuts have been selling opportunities. Lower high in September, risk of a double top:
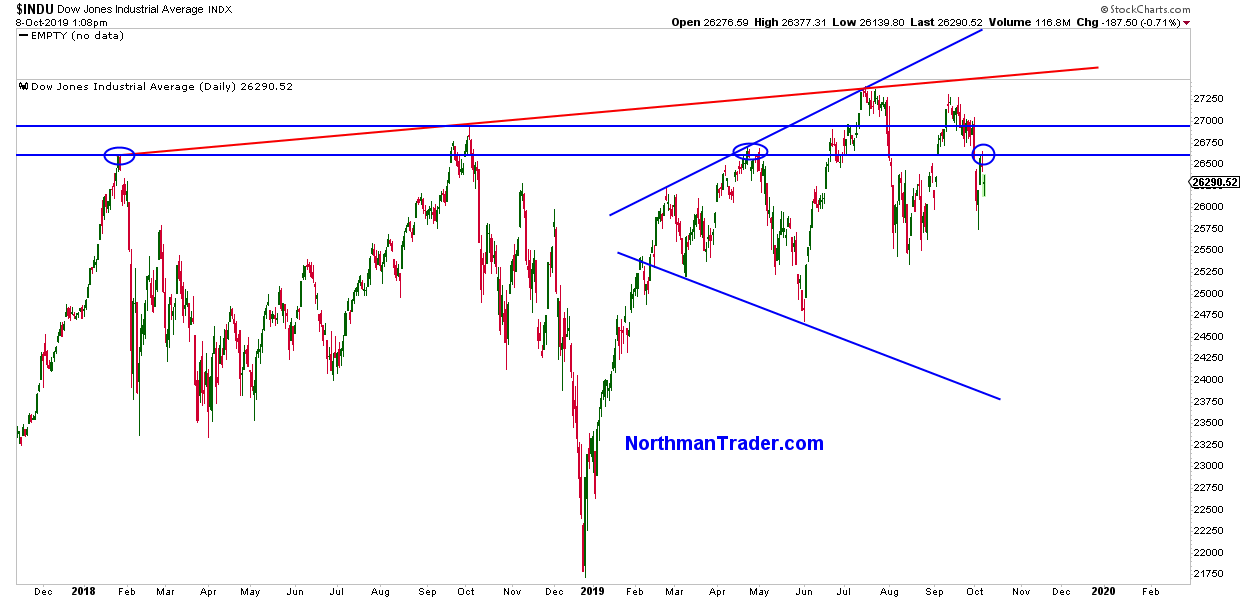
We see several relevant trend lines on the chart above and I could discuss these here, but I want to highlight something completely different and that is: Why is $DJIA rejecting these price zones above 26500?
Well, as it turns out, there is a technically relevant resistance point precisely at the October 2018 highs, the 2.618 fib from the 2009 lows and 2007 highs:
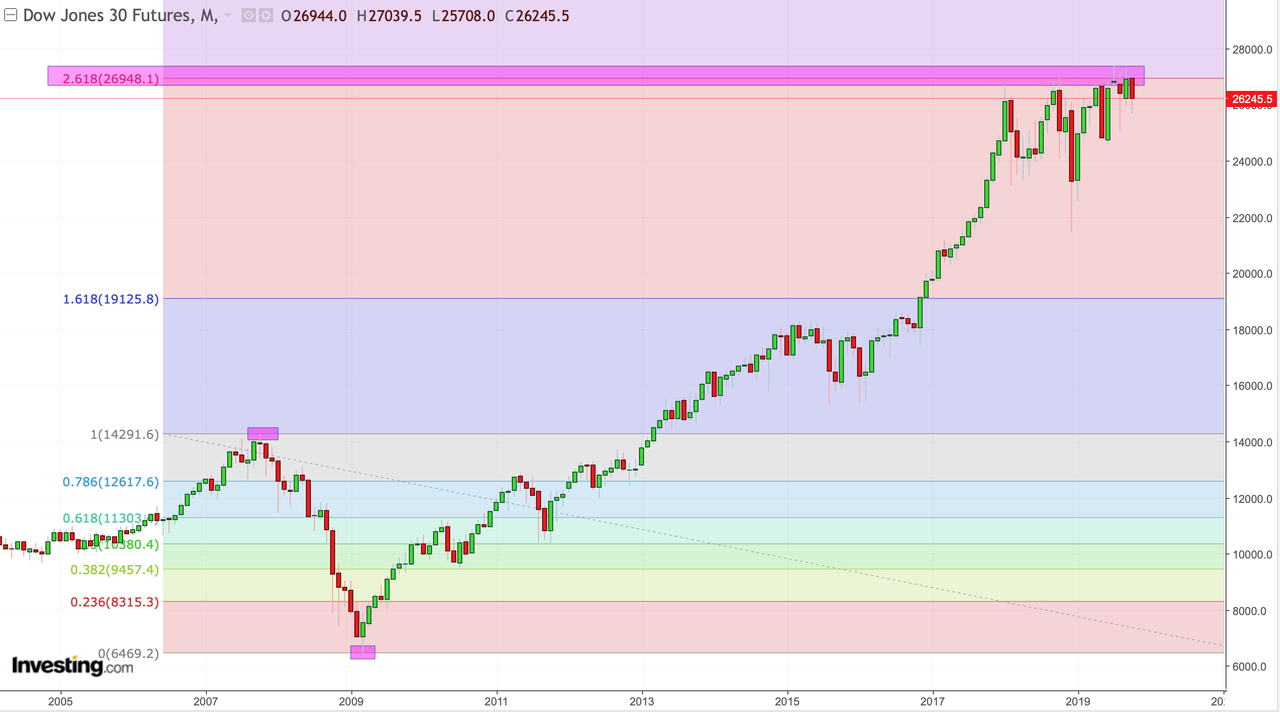
26948 on the futures contract. In fact, what's notable here is that $DJIA has tried 5 times to get above that zone on a monthly basis and has failed every single time to close above it by month end. Even the current October highs have tagged there and now rejected again.
Here's a close-up for clarity purposes: