


Breaking News
 BREAKING: Federal Agents Descend on Suspected Somali Fraud Sites in Minneapolis (VIDEO)
 BREAKING: Federal Agents Descend on Suspected Somali Fraud Sites in Minneapolis (VIDEO)
 Aargh! Letters of marque would unleash Blackbeard on the cartels
 How a Barter System Could Sustain Communities During a Supply Chain Collapse
Top Tech News
 EngineAI T800: Born to Disrupt! #EngineAI #robotics #newtechnology #newproduct
 This Silicon Anode Breakthrough Could Mark A Turning Point For EV Batteries [Update]
 Travel gadget promises to dry and iron your clothes – totally hands-free
 Perfect Aircrete, Kitchen Ingredients.
 Futuristic pixel-raising display lets you feel what's onscreen
 Cutting-Edge Facility Generates Pure Water and Hydrogen Fuel from Seawater for Mere Pennies
 This tiny dev board is packed with features for ambitious makers
 Scientists Discover Gel to Regrow Tooth Enamel
 Vitamin C and Dandelion Root Killing Cancer Cells -- as Former CDC Director Calls for COVID-19...
 Galactic Brain: US firm plans space-based data centers, power grid to challenge China


West Virginia Has The Highest Share Of Income-less Households
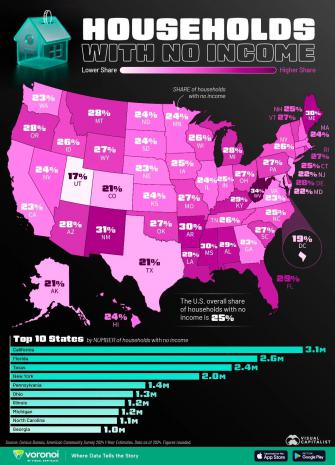
This map, via Visual Capitalist's Niccolo Conte, highlights the share of households with no income across U.S. states (and the District of Columbia) in 2024 using data from the Census Bureau, American Community Survey 2024 1-Year Estimates.
States with the Highest Shares of No-Income Households
Across U.S. states, the share of households with no income ranges from a low of 17% (Utah) to a high of 34% (West Virginia). The United States' overall share of no-income households is 25%.
The data table below lists each state's share of households with no income:
| West Virginia | 34% |
| New Mexico | 31% |
| Maine | 30% |
| Arkansas | 30% |
| Mississippi | 30% |
| Alabama | 29% |
| Louisiana | 29% |
| Florida | 29% |
| Kentucky | 29% |
| Michigan | 28% |
| Montana | 28% |
| Delaware | 28% |
| Arizona | 28% |
| Oregon | 28% |
| Vermont | 27% |
| South Carolina | 27% |
| Rhode Island | 27% |
| Oklahoma | 27% |
| Pennsylvania | 27% |
| Wyoming | 27% |
| Ohio | 27% |
| Missouri | 27% |
| Idaho | 26% |
| Wisconsin | 26% |
| Tennessee | 26% |
| New York | 26% |
| North Carolina | 25% |
| U.S. Overall | 25% |
| Connecticut | 25% |
| Indiana | 25% |
| Iowa | 25% |
| New Hampshire | 25% |
| Hawaii | 24% |
| Nevada | 24% |
| South Dakota | 24% |
| Illinois | 24% |
| Minnesota | 24% |
| Massachusetts | 24% |
| Kansas | 24% |
| North Dakota | 24% |
| Washington | 23% |
| Georgia | 23% |
| Nebraska | 23% |
| Virginia | 23% |
| California | 23% |
| New Jersey | 22% |
| Maryland | 22% |
| Alaska | 21% |
| Colorado | 21% |
| Texas | 21% |
| District of Columbia | 19% |
| Utah | 17% |